|
Methods of Trading
- Patterns
- Support & Resistance
- Momentum
- Reversion to Mean
- Tells
- Fundamentals
- Sentiment
|
 |
Patterns
Patterns are one of the oldest and most widely used methods for forecasting price movement. The idea behind patterns is
that people react in similar ways in certain well defined circumstances. Patterns have specific entry points and sometimes specific exit points.
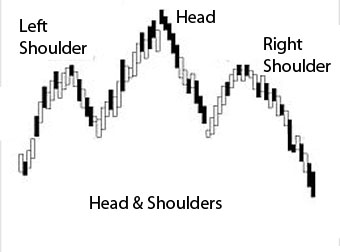
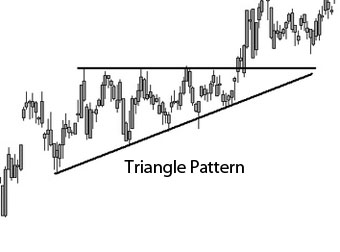
There are a number of patterns and types of patterns available to use. At the right are two common chart patterns that traders rely on. There are also
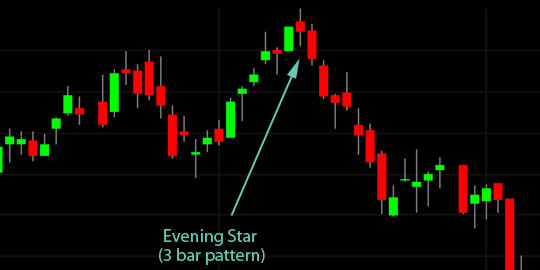
patterns based on one or two (or more) candlestick patterns, such as the Doji patterns (below). There are also more obscure patterns
like those used on point-and-figure charts (not my cup of tea).
|
|
|
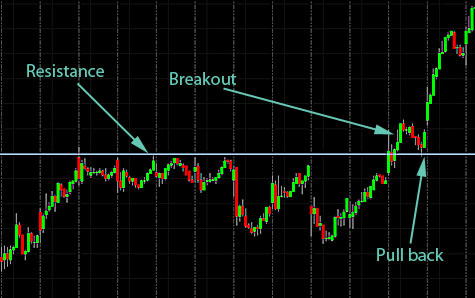
Support & Resistance
|
Trading support and resistance is a core method for me. If a stock, futures contract, or currency pair does not show good adherence to principles
of support (doesn't want to go below a certain price without a fight) and resistance (price levels that are somewhat hard to get through) then I
am not interested in trading it.
Support and Resistance (S/R) can be calculated for different time frames. For intra-day trading of stocks or stock indexes (including futures on
stock indexes) I find the Floor Trader Pivot calculations to work best. On daily charts you can usually see the zones of support and resistance by
looking back several months. Fibonacci ratios are often used by traders to forecast S/R levels and evaluate the likelihood that a pullback will be
buyable.
Horizontal lines are used for S/R. Sloped lines are called trend lines and channels, which are different (see below). We will discuss
this more in a later segment.
|
|
Momentum
Momentum trading is when an instrument (stock, futures contract, bond, currency pair) is moving at a steady pace and in a clear direction, often cutting through
the S/R levels with relative ease. Time of day is often critical in that mornings and afternoons are best for momentum but midday is usually a bad time
to trade momentum. Abnormally high volume is a sign that momentum is strong. Declining volume is a sign that the momentum is fading. We have a proprietary
tool for trading stock indexes that looks at a bunch of underlying stocks from that index to see when momentum is strong or fading (you can get a free trial at
TradingComputers.com, it is the Falcon Reversal Indicator).
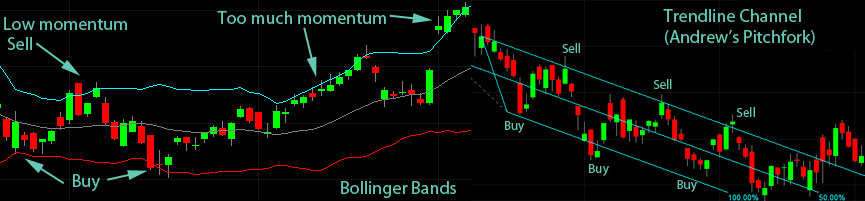
Reversion to Mean
Reversion to mean is a method that appeals to engineers and scientific traders a lot. It uses some fancy scientific math like standard deviation.
The concept is the assumption that both a stock's high and low prices are temporary and the stock's price will tend to move back to the
average price over time. Bollinger bands, trend lines, channels & the McClellan Oscillator follow this assumption in one way or another.
Mean reversion works well in markets that have low momentum. If the market has too much momentum then you will lose every trade until the momentum slows.
Tells
Tells are a small group of stocks that you watch to discover early warning signs that momentum is fading, building, or reversing. The method of
picking tells is the key to making them work but it is too long a discussion for this segment. Capital Management Institute (of which I have
an interest) uses Tells a lot and they can teach you how to use them. The idea is that you can discern the mood of the market through the Tells.
Let's say Microsoft has just reported earnings and the top and bottom line numbers were good. However, on the earnings call they only beat on
the bottom line because of a one-time tax credit loophole. I would watch that stock the next day as a Tell: is the market a glass half full
market or a glass half empty market? If Microsoft gets whacked the next day then long trades that day would be much more risky because the market
is in an unforgiving mood.
Fundamentals
Fundamentals are the classic Wall Street fund manager's tool for deciding when to buy or sell. Jim Cramer uses it along with most of the people on the
CNBC show Fast Money. Fundamentals are hard to fully understand as a professional fund manager, much less a private trader. I prefer technical
analysis with a some fundamentals thrown in. It is better to be long fine companies and short bad ones than the other way around. Most fund managers
pay for highly educated analysts opinions and they still get it wrong far too often, so don't spend too much time on it but don't be totally ignorant of it either.
The problem with fundamentals can be compared to buying a classic car. Most car guys in their 50's or older know that the Olds 442 was a hot muscle car in
its time and should be valuable and collectable. However, an Old's 442 is only valuable to collectors if it has a manual transmission (no matter how good the rest of
the car is). Most amateur muscle car buyers don't know this and might overpay for a 442 with an automatic transmission. The same is true for for fundamentals.
For example, in the semiconductor business the book-to-bill ratio is the most important thing to know when earnings are released. For telecom stocks you
need to know the "churn rate" (how many customer are lost to competitors) and if the churn is a little high then you need to look at the CAC (customer
acquisition cost) to replace the churn losses.
It is hard to reasonably know everything about fundamentals in sufficient detail for all the stocks you want to trade. It is a fine approach to improve
your results for long term retirement investing, but for trading you should use technical analysis (the other stuff in this list of methods).
Sentiment
Sentiment is a gauge of the overall attitude of market participants. If everyone is bullish then they are probably all fully invested and there
are no buyers left. It is contrarian logic in that if everyone is on the same side of the trade then it will reverse the other way. Market bottoms are made
when everyone is so bearish that there are no sellers left. Sentiment does not give a precise entry point but can help you manage risk or embolden
you to stay long even though the market seems overbought or the fundamentals seem weak.
On Wall Street they say that the market "climbs a wall of worry" which is a sentiment statement: If everyone is worried then there is still plenty
of uncommitted money left to buy more stocks. There are many ways to measure sentiment, such as how much money is loaned out on margin to traders,
or surveys of bullishness/bearishness. Doug Kass at RealMoney.com uses sentiment to successfully decide his ratio of longs to shorts at his hedge fund.
It is an important additional tool but often is delayed in its effect.
Scott Tafel is the founder and principle partner in Falcon Trading Systems: computers for traders. He has been a trader
since 1999. Mr. Tafel spent 27 years working in the Nuclear power industry, principally as a Nuclear Reactor Operator.
|
|
|